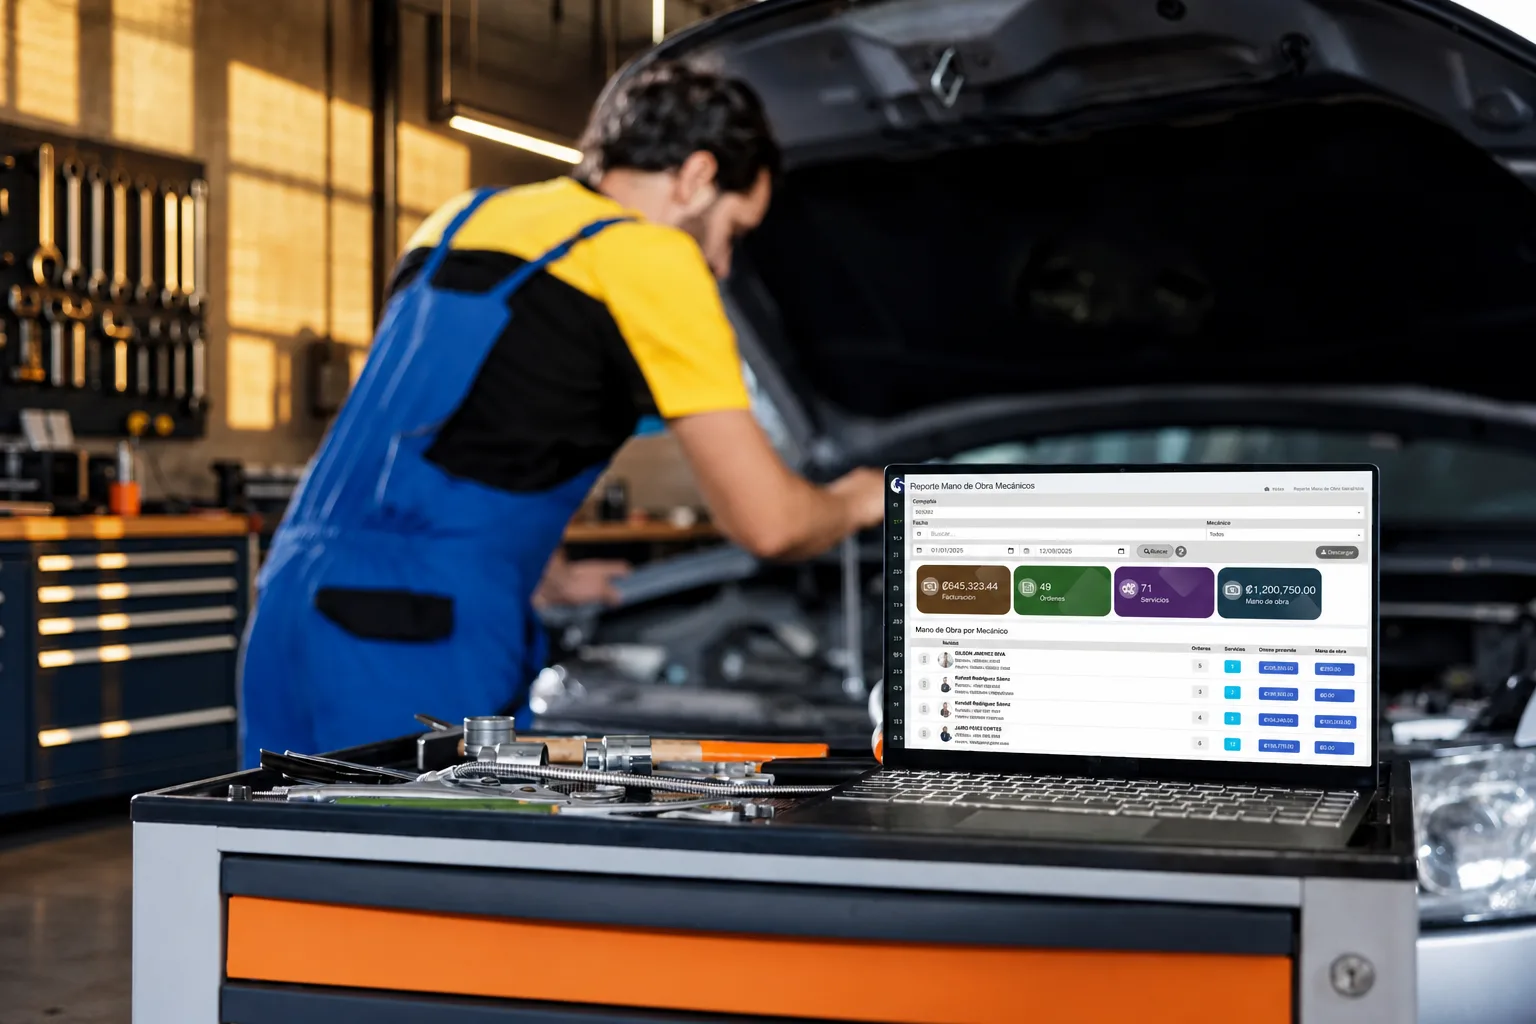
An auto repair shop KPI is a number that answers a specific question: are repair orders closing on time? does the team have capacity? where is work piling up? are labor rates and costs being reviewed? The goal is not to fill a screen with figures — it is to use a few useful numbers to make better calls.
This guide covers metrics any shop can calculate. The formulas use made-up examples and do not represent Taller Alpha results, percentages or automations.
KPIs worth tracking in an auto repair shop
| KPI | What it measures | Formula or how to get it | What decision it supports |
|---|---|---|---|
| Car count | Volume of work handled | Count repair orders opened or closed in a period. | Review workload and capacity. |
| Cycle time | How long the process takes | Close time − check-in or start time. | Spot stages taking longer than planned. |
| Technician productivity | Completed work vs. available time | Billed or productive hours ÷ available hours. | Identify support, assignment or training needs. |
| Technician utilization | Share of available time spent on productive work | Productive hours ÷ available hours × 100. | Adjust the schedule, assignments and capacity. |
| Late deliveries | Vehicles delivered past the promised time | Late ROs ÷ completed ROs × 100. | Review estimates, parts and bottlenecks. |
| Average Repair Order (ARO) | Average dollar amount per RO | Period sales ÷ number of invoiced ROs. | Understand shifts in the service mix. |
| Effective Labor Rate (ELR) | What you actually collect per billed hour | Labor sales ÷ billed labor hours. | Spot discounting and under-billed hours. |
| Parts consumption | Parts tied to repairs | Track products or parts used per RO. | Plan purchasing and catch stockouts. |
| Comebacks | Jobs that need to be redone or corrected | ROs with a comeback ÷ completed ROs × 100. | Improve diagnosis, QC or process. |
You do not need all of them on day one. Pick the ones that speak to a problem you can already see in your shop.
Reading productivity without blaming the technician
Productivity is not simply “who closed the most tickets.” A tech can show fewer ROs because they drew the hard diagnostics, waited on an approval, or never got the parts. So look at the context: type of service, available time, assigned tasks and where the process stalled.
For example, if a technician had 30 available hours and logged 21 productive hours, the reference utilization would be:
21 ÷ 30 × 100 = 70 %
Before concluding they need to “step it up,” ask what happened in the other nine hours. There may be an opportunity to prep ROs better, clean up the parts room, or distribute work differently.
Productivity vs. efficiency. Many US shops track both and they are not the same. Productivity compares billed hours against the hours a tech was clocked in and available. Efficiency compares billed hours against the hours actually spent turning wrenches on those jobs. A tech can be highly efficient and still show low productivity if the shop keeps them waiting.
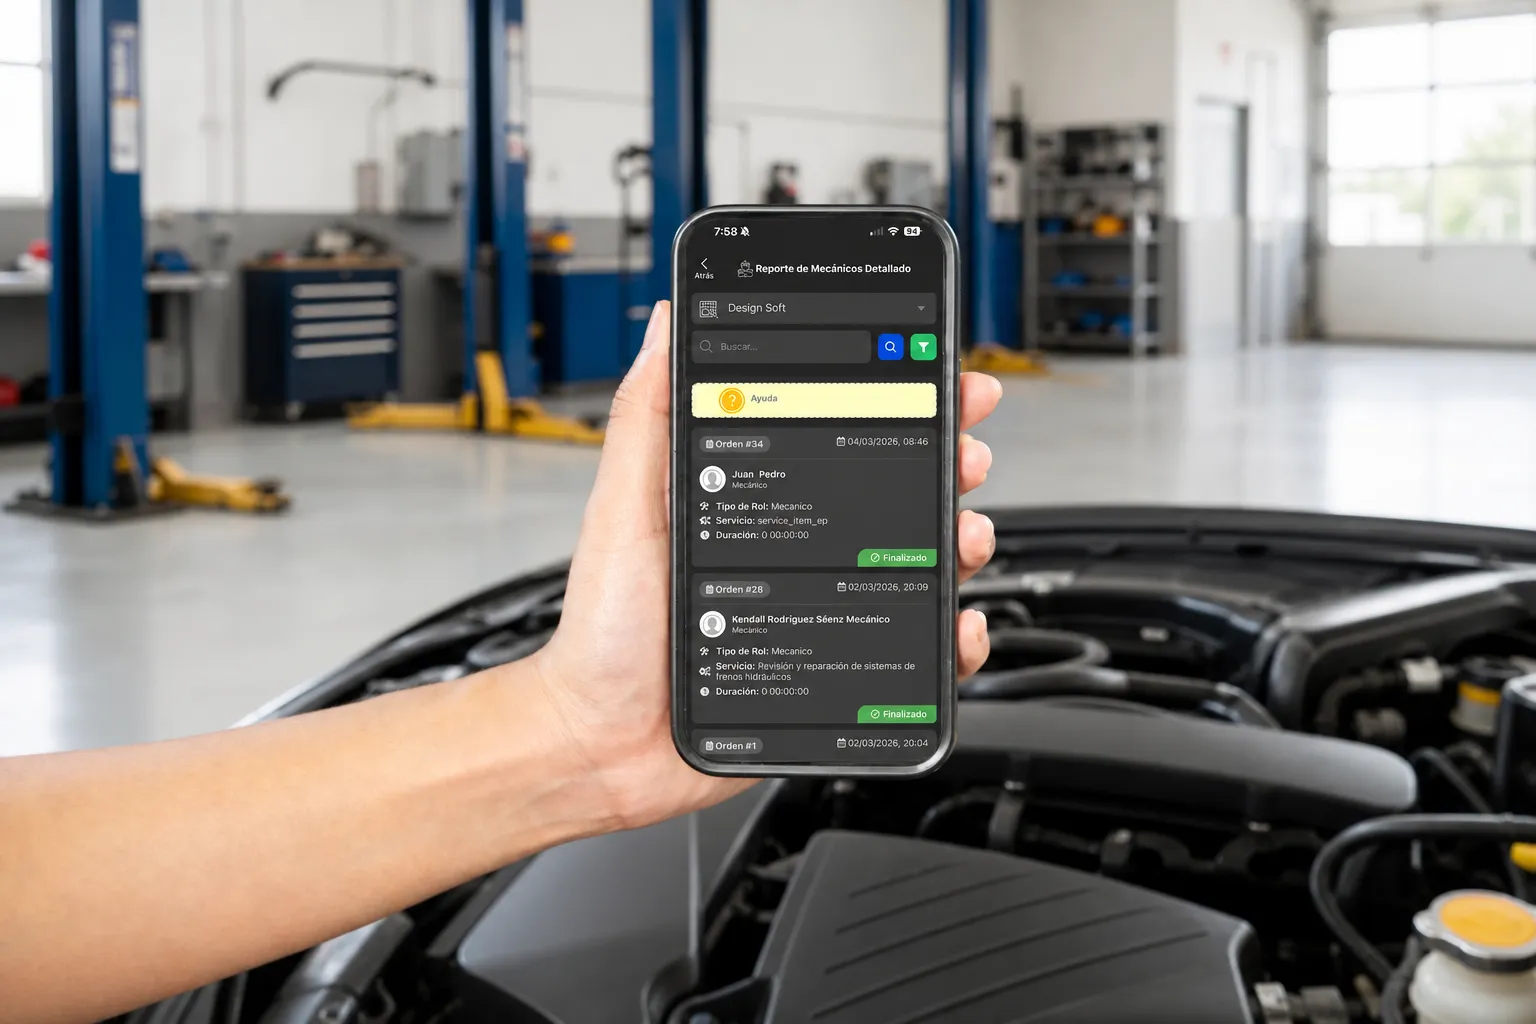
Cycle time: the KPI that finds your bottleneck
Total time on a repair order shows you where work sits still. An RO can drag because of diagnosis, waiting on authorization, missing parts, technician assignment or final QC. Measuring total time is not about rushing every stage — it is about finding what needs to improve.
Start by comparing similar services. If a routine maintenance job keeps taking longer, check whether the scope changed, whether the schedule is promising times nobody can hit, or whether the team is burning hours hunting for information and materials.
Sales, ARO and costs: look at the whole result
Sales matter, but on their own they do not tell you whether the shop is running well. A month can post higher sales while also carrying too many comebacks, too many hot-shot parts runs, and too many late deliveries.
Average Repair Order is calculated like this:
Invoiced sales ÷ invoiced repair orders = ARO
If a month invoiced $10,000 across 50 repair orders, the made-up ARO would be $200. That figure does not say whether the result is good or bad; it lets you compare similar periods and ask better questions: did the service mix change? are parts being captured on the ticket? are estimates approved with the right scope?
Effective Labor Rate is the companion metric. Your posted door rate is what you advertise; ELR is what you actually collect per billed hour after discounts, unbilled diagnostic time and hours that never made it onto the ticket. If your door rate is $140 and your ELR is $105, the gap is the story worth chasing.
To talk about margin or profitability you also need real costs. Do not just subtract a rough figure from sales. Review labor, parts, operating expenses and the scope of each service before drawing conclusions.
What to review daily, weekly and monthly
- Daily: appointments and open ROs, completed jobs, delays that need a customer call, and parts holding up a repair.
- Weekly: cycle time, workload per technician, utilization, and comebacks or returns that need review.
- Monthly: sales, ARO, effective labor rate, costs, parts consumption and delivery-time trends.
This cadence avoids two extremes: checking numbers once a year when it is already too late, or chasing dashboards hourly with no time left to act on them.
What Taller Alpha shows, and how to use it with judgment
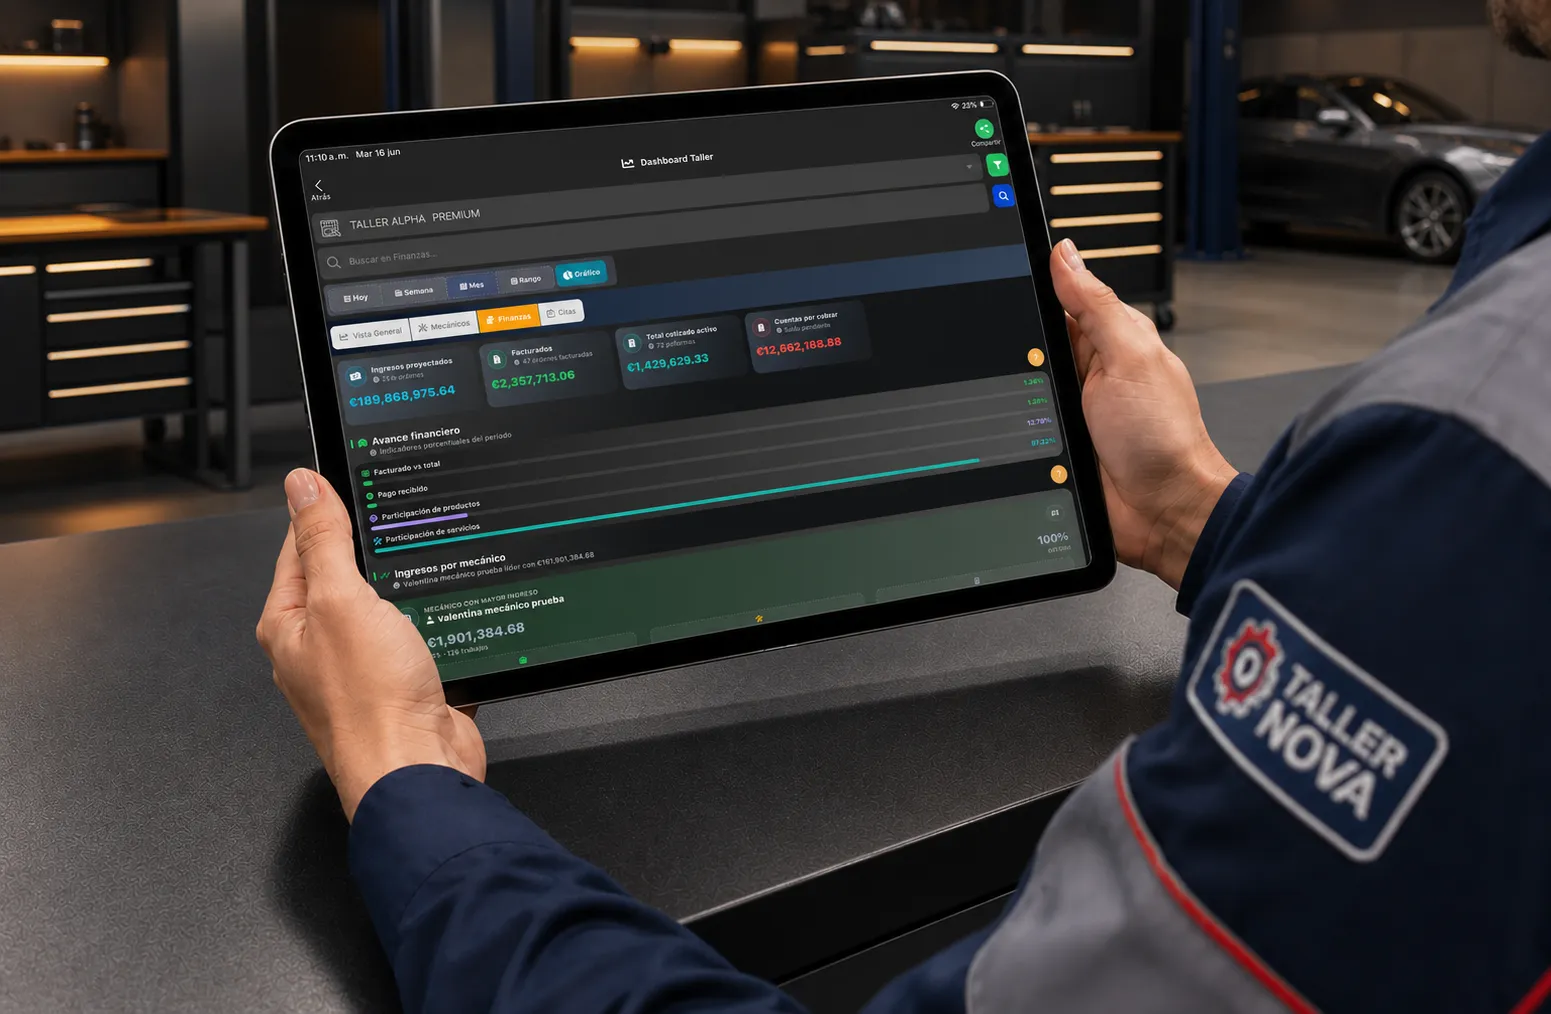
Taller Alpha surfaces information tied to repair orders, labor by technician, services, invoicing, sales, collections, inventory and parts. That data can serve as the base for reviewing the operation and structuring follow-up conversations.
It does not mean every KPI in this guide is calculated automatically, or that a dashboard replaces the service manager’s analysis. Formulas, periods and comparison criteria have to match how your shop actually works. To see the reports available inside the product, check the reporting system for auto repair shops.
Common mistakes when tracking metrics
- Measuring too many things and deciding nothing.
- Comparing technicians without accounting for job complexity.
- Treating sales as the only sign of shop health.
- Ignoring delays, comebacks and parts waits.
- Turning a KPI into a penalty instead of a process improvement.
Use KPIs to improve the operation
A good metric raises a question; it does not hand down a verdict. If cycle time climbs, look at the workflow. If utilization drops, look at assignments and availability. If comebacks rise, look at diagnosis and QC. That conversation is what turns data into real improvement.
To centralize repair orders, services, technicians, sales and follow-up in one place, take a look at Taller Alpha’s auto repair shop management software. You can also request a demo.